The bot report summary looks similar to the Dashboard, however - it has a few key differences such as:
- Summary
- Events
- Consumers
- Data Enrichment
- Copy Share URL
- Search
- Export
- Open Conversation
Find it by clicking on the report summary icon:
You can find this on the Dashboard in the "All Bots" section OR on the "Bots" page itself.
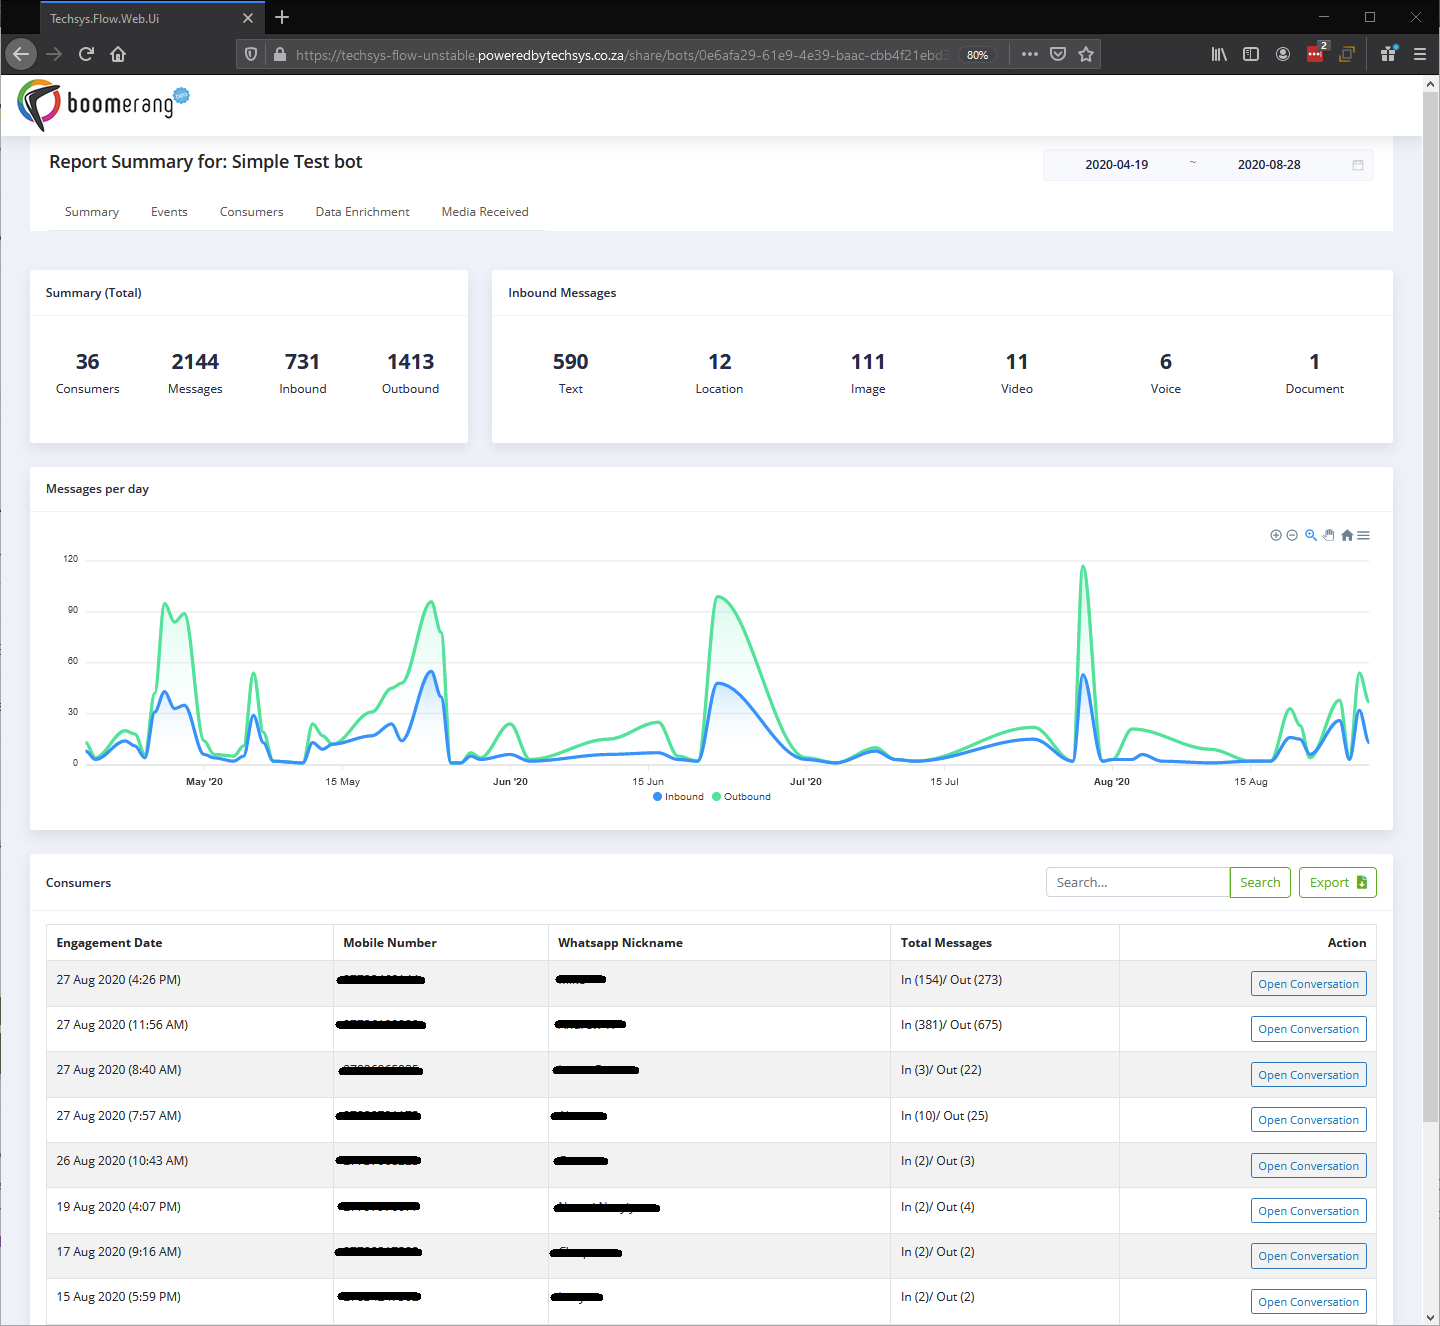
Here is a screenshot of what an example of a report for a bot would look like:
Let's explore each of these features.
1. Report Summary Bar
This element shows you the name of the bot report you are looking at, the date picker, a few tabs for different reporting metrics and a "Copy Share URL" button.

Let's explore each element in more detail:

- Back button to return to the "Bots" list.
- Report Summary for: The name of your bot here.

Report tabs for the different reporting metrics available for your bot. Click on them to switch between the tabs.

The date picker - use this to select the date range over which you'd like the reporting data to appear for.

Use this button to share the report with 3rd parties (by email or any method of your choice). Clicking it will produce the notification window (in the top right of the Boomerang window):

A URL will be created which you can paste, it will look as follows:
When pasted into a web browser or clicked on by a user, will produce a page like this:

2. Summary (Total)

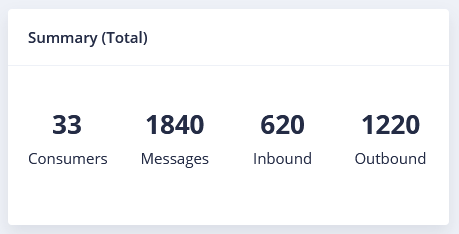
The Summary mirrors much of the same information that appears on the Dashboard page, however, unlike the Dashboard page, this is a summary for a specific bot that you are looking at, taking into account the date range you have selected.
This block summarizes a totaled value for each metric over the selected date range.
3. Inbound Messages

Inbound messages will show you a total breakdown of all messages received by type.
The sum of all of these messages will equal the total "Inbound" messages shown in the Summary (Total) in the previous section above.
4. Messages per day

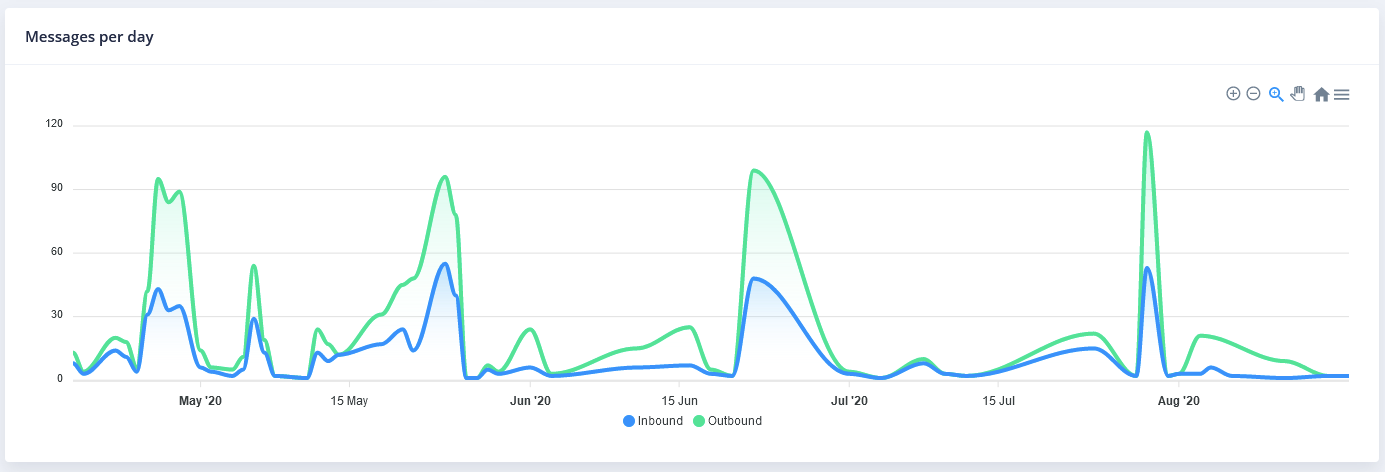
This graph will show you the traffic in and out of your bot over the selected date range by "Inbound" and "Outbound" message traffic specific to the bot you are looking at, and within the selected date range.
Read more about how to interact with this graph in the "Dashboard Overview" section where we unpack in more detail how this chart feature works here.
5. Consumers
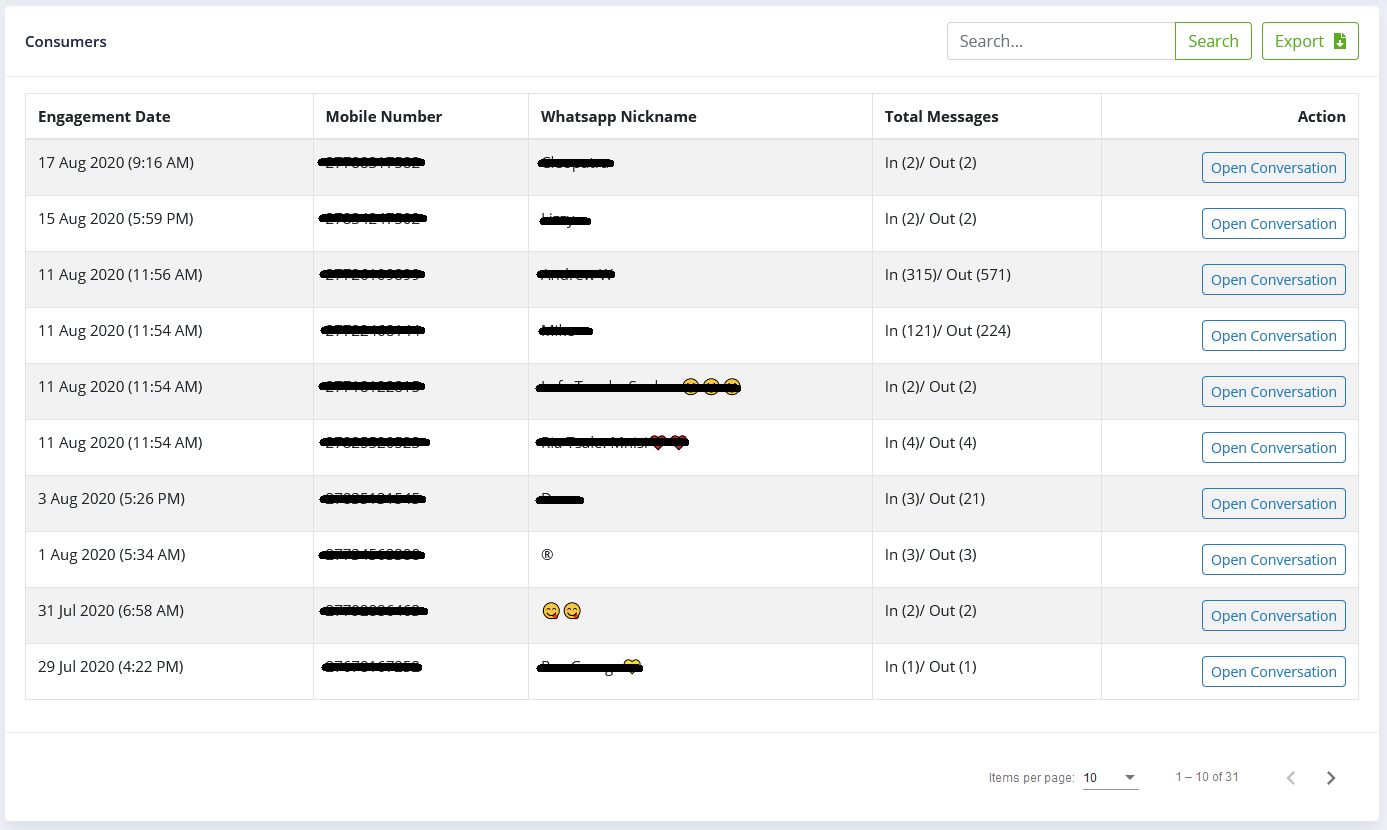
While looking similar to the Dashboard Overview's "All Bots" section, this one has a number of differences.

The following activities can be performed:
- Search for data.
- Export the data (to an Excel file).
- Open Conversation (See "Action" in the below list).
The tabular data displayed here will provide you with:
- Engagement Date - The date on which a user interacted with your bot.
- Mobile Number - The mobile number of the user from which the interaction with your bot took place (and also where any data collected about the consumer is stored against (such as variables eg: "@@Gender" etc.).
- Whatsapp Nickname - If the variable "@@Nickname" has a value stored for it, this is what will appear here.
- Total Messages - Shows (based on the Engagement Date) the number of inbound and outbound messages which took place with the bot. Inbound being interactions FROM the user TO your bot, and outbound interactions being the inverse of this.
- Action - Open Conversation: This allows you to view the entire interaction stream which took place between your bot and the user.