
In the "Report Summary - Overview" article, we covered the basic interface layout, so we will now explore the Report Summary Bar in detail again. For this article, we are looking at the "Events" tab:
We will look at the following elements of Events as follows:
- Event Summary
- Events achieved per day
- Events Achieved
The tab will load like this:
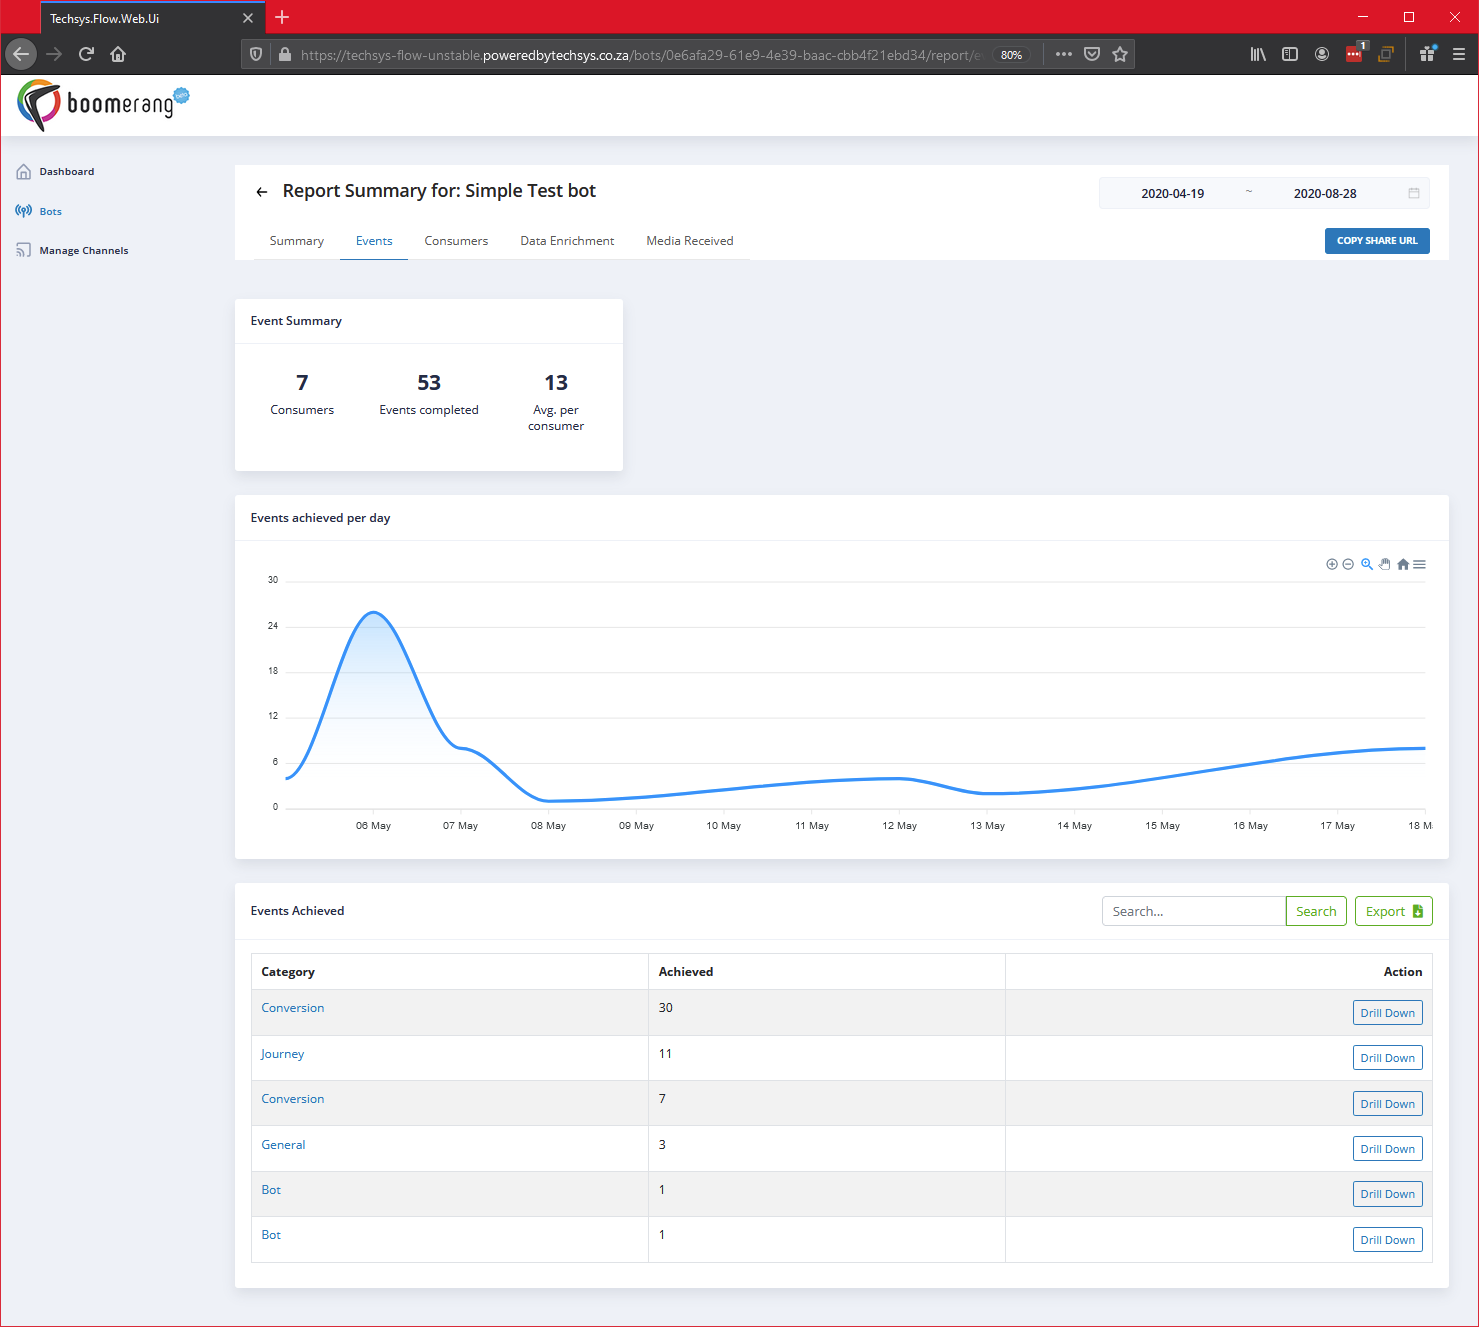
Let's explore each of these features.
1. Event Summary
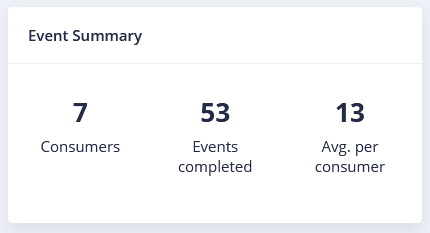
The Event Summary shows a totaled view of:
- Consumers - Who triggered an event.
- Events completed - All the events completed for the number of Consumers who triggered them.
- Avg. per consumer - Shows an average number of events triggered per consumer calculated as "Events completed / Consumers = Avg. per consumer".
2. Events achieved per day
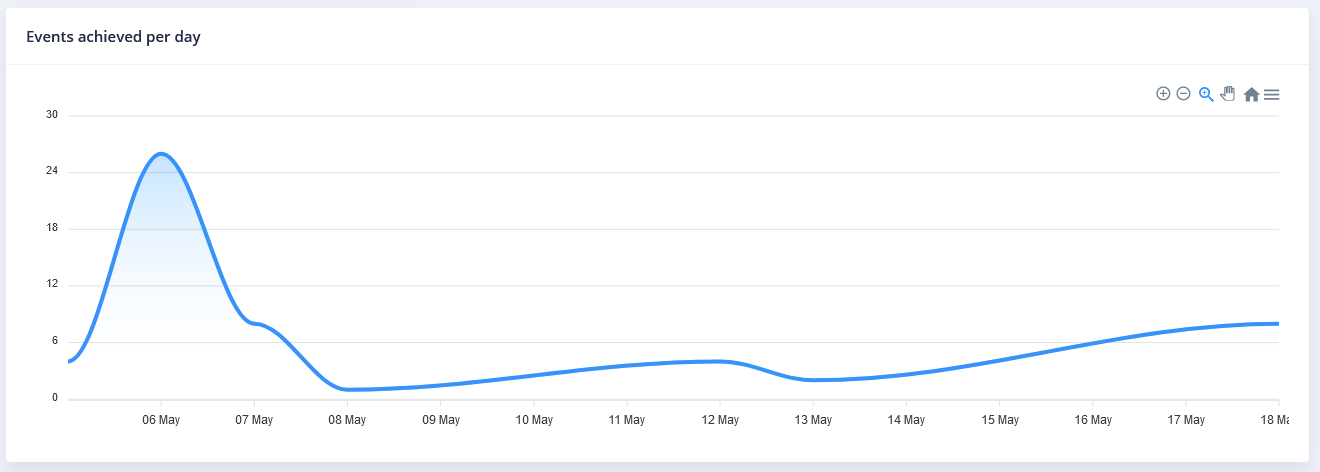
This graph will show you the events triggered for your bot over the selected date range.
Read more about how to interact with this graph in the "Dashboard Overview" section where we unpack in more detail how this chart feature works here.
Functionally it works identically to the "Messages per day" chart with the only exception being the actual data being displayed.
3. Events Achieved
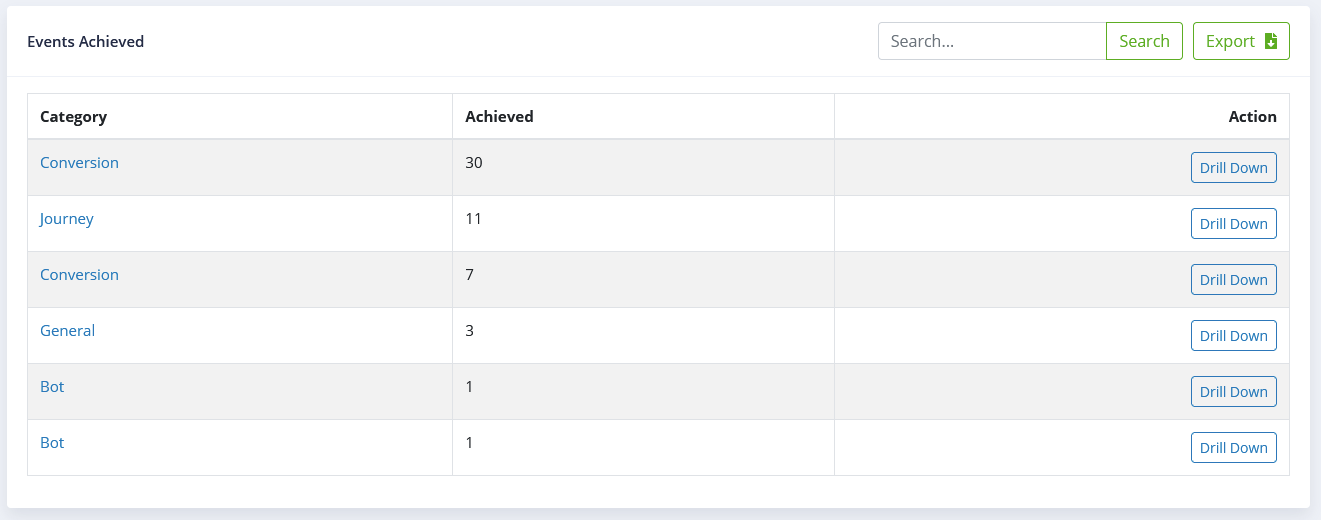
The events achieved table is an incredibly powerful feature of Buildabot in that you can start exploring (in detail) the events you've setup in your bot.
The following activities can be performed:
- Search for data.
- Export the data (to an Excel file).
- Drill Down (See "Action" in the below list).
The tabular data displayed here will provide you with:
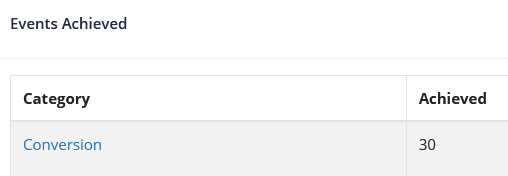
- Category - The category of the event. Each category is clickable. Clicking on the category word hyperlinked in blue will have the same effect as using the "Drill Down" button under the action column.
- Achieved - Is a sum of the total events achieved within the corresponding category within the selected date period for your report.
- Action - Drill Down: This allows you to view the next level of the category.
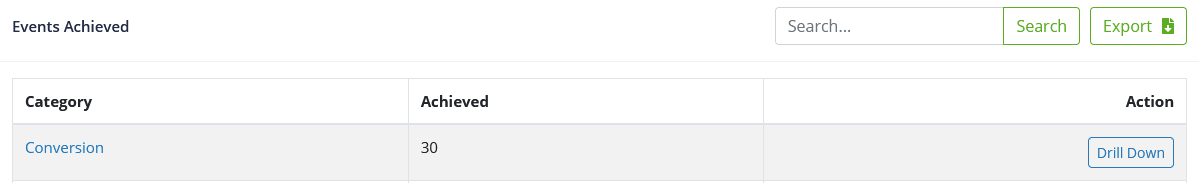
Let's use the Action "Drill Down" to take a look at what happens.
Click either the blue hyperlinked text "Conversion" for the Category type or on the "Drill Down" button under the action column.
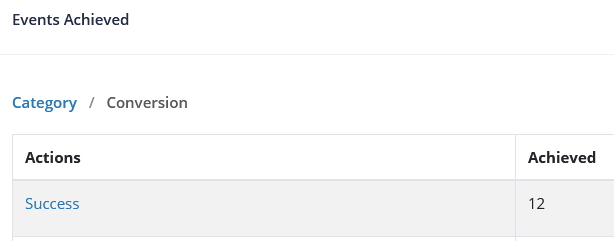
Your table will refresh now displaying the "Actions" for the selected "Category" appear:
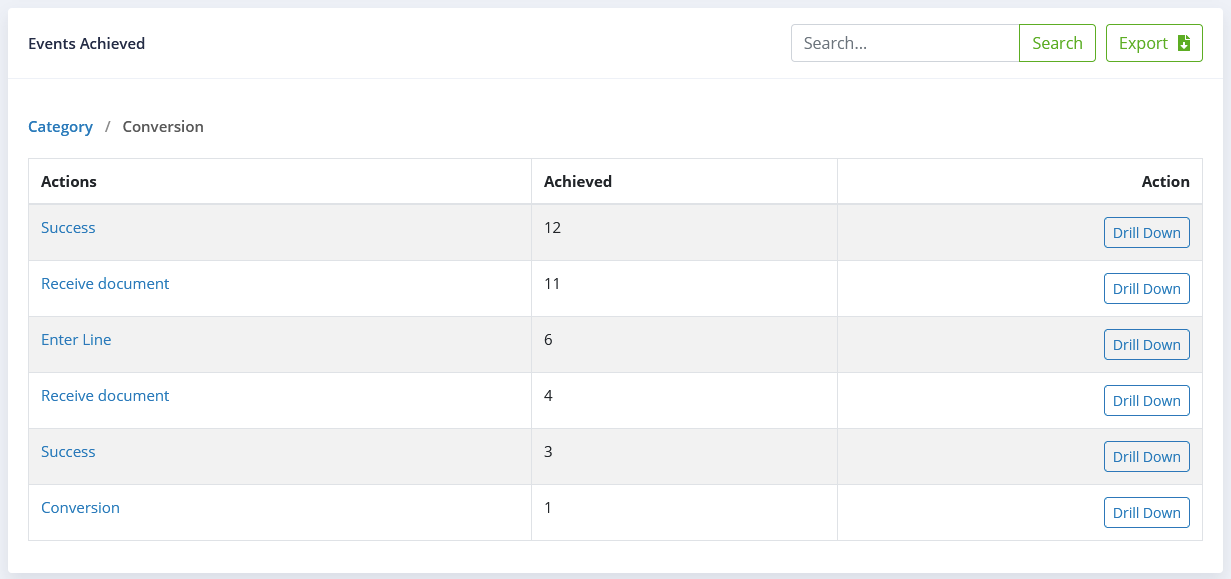
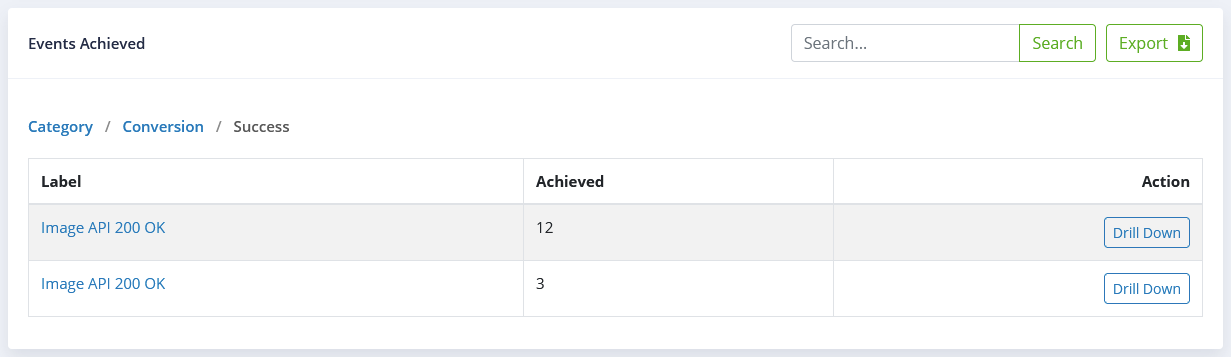
You can go one step further by viewing the "Labels" you provided for your event also by (again) clicking on the blue hyperlinked text or the "Drill Down" button. For this article we are going to use the "Success" action:
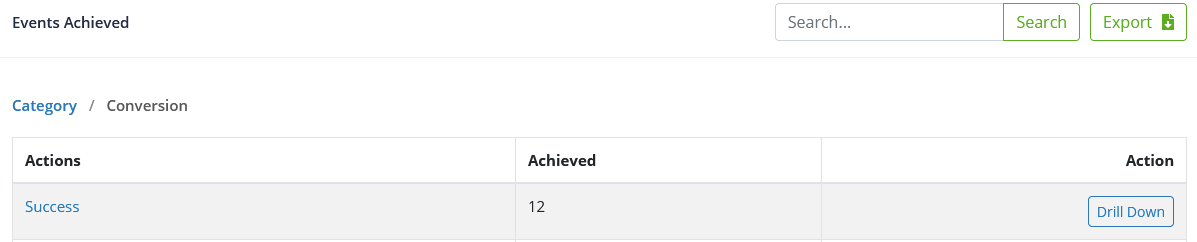
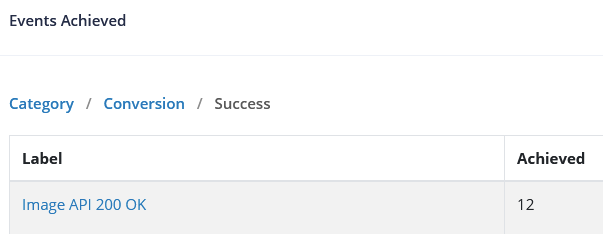
Your table will refresh now displaying the "Labels" for the selected "Action" appear:
And finally, you can drill done once more to view all the users who were responsible for triggering your entire series of Events specific to the combination of Event Category by Action by Label:
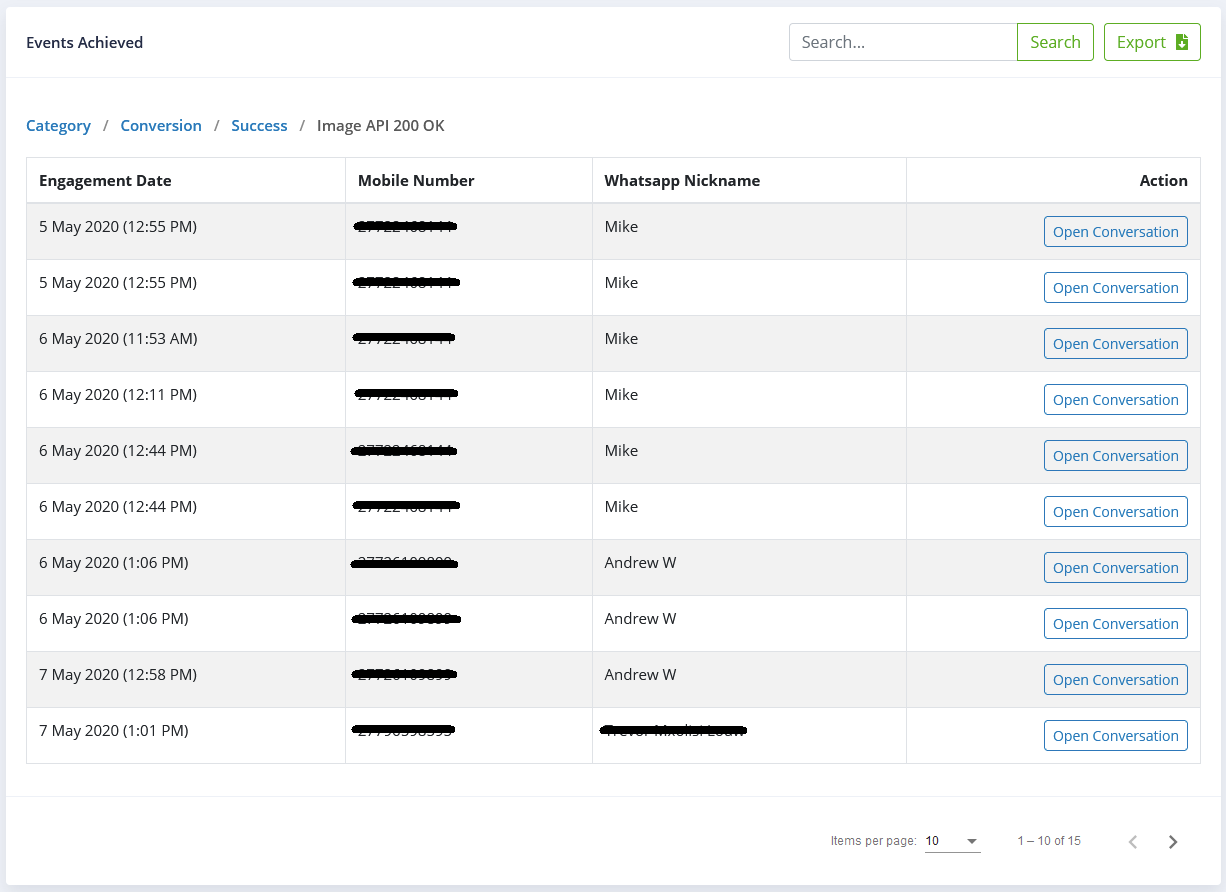
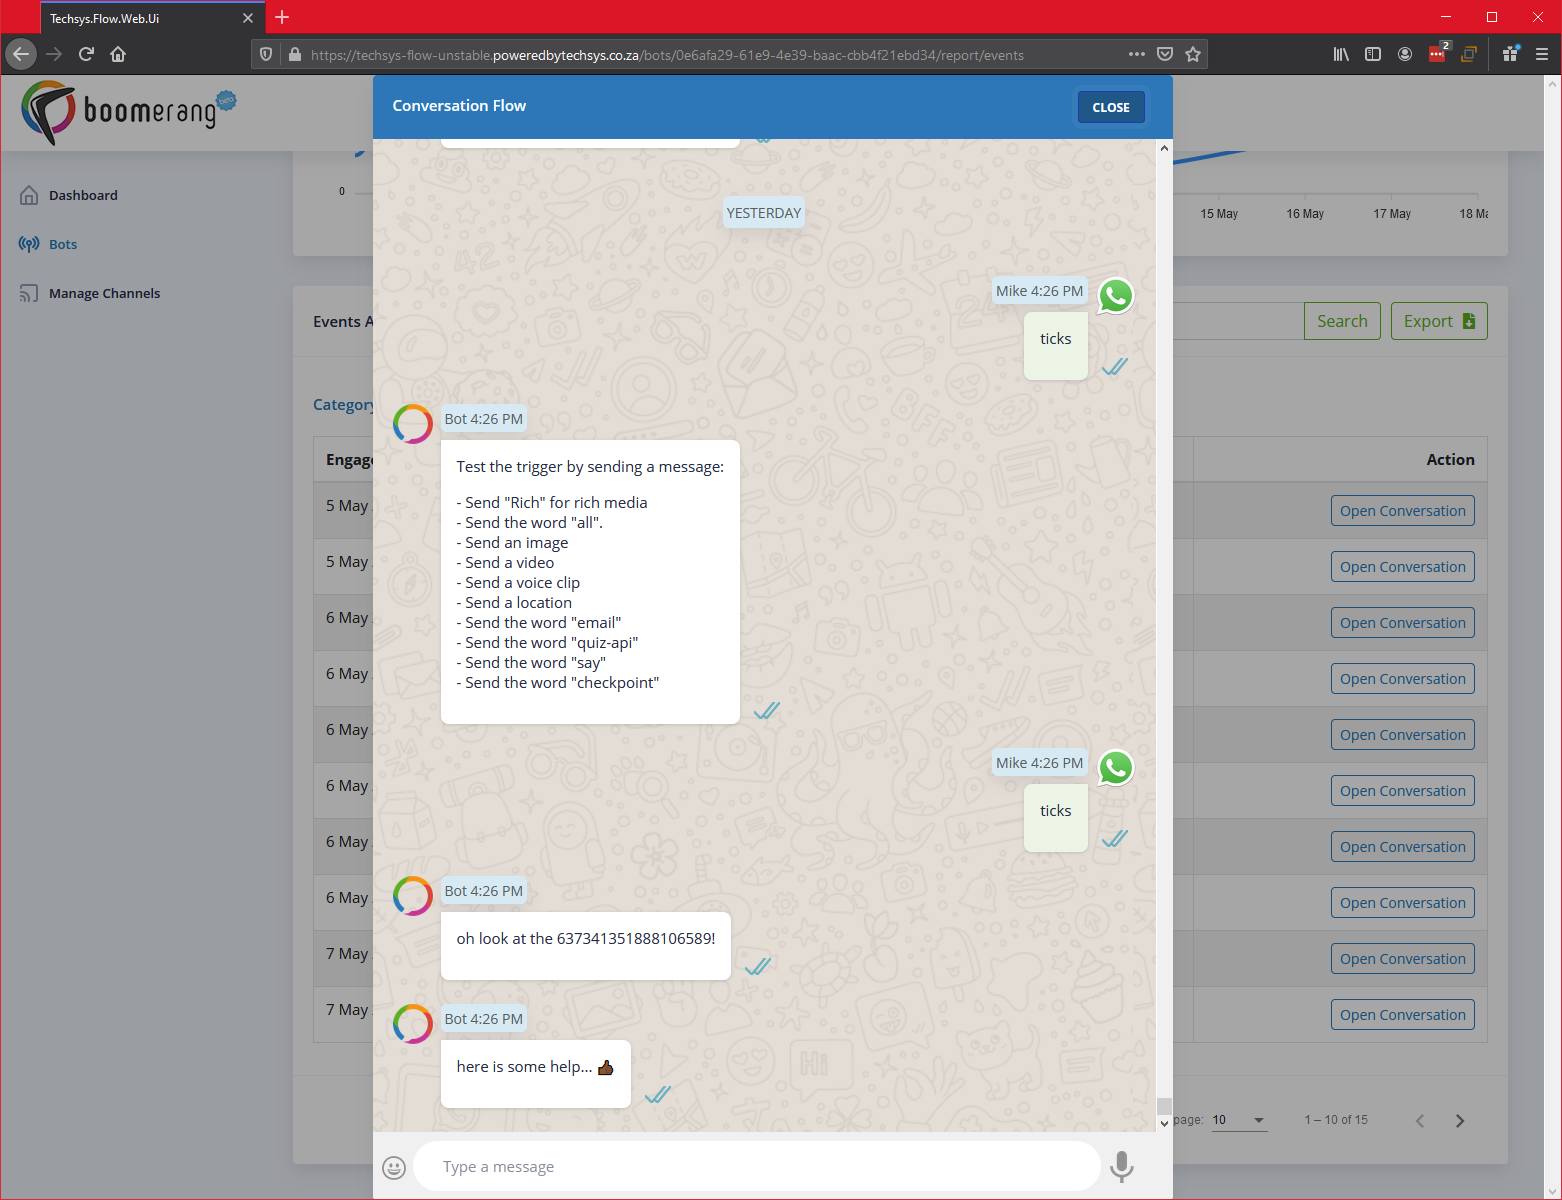
If you'd like to view the actual conversation which resulted in this event taking place, click on the "Open Conversation" button under the Action column to view it:
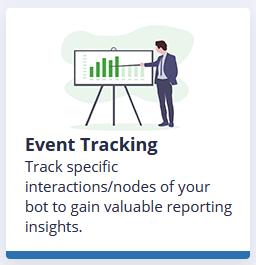
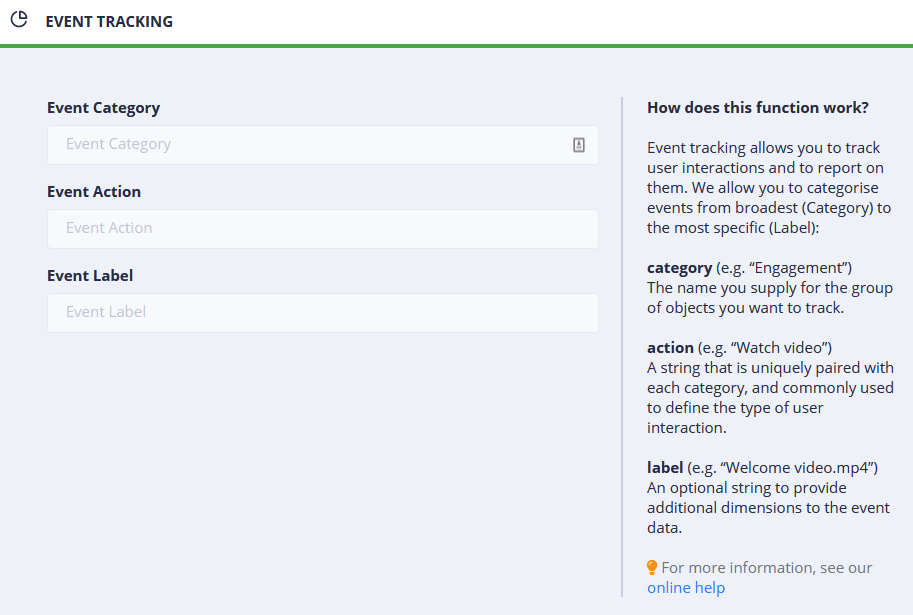
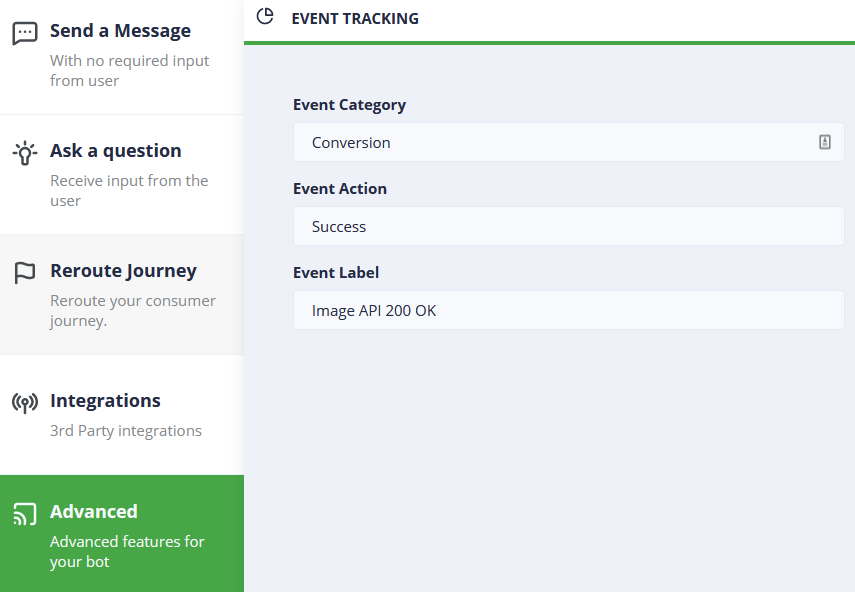
Event Tracking (Advanced category) in the Bot Builder:
The Event Tracking block window where you set your Event Category, Event Action and Event Label.
So, lets take a quick look at how these tie in from the Bot Builder and your report:
| EVENT TRACKING BLOCK | CORRESPONDING EVENT REPORT | NOTES |
|---|---|---|
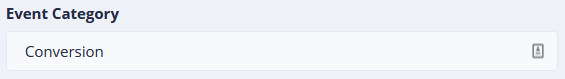 |  | The category will display the Event Category name of "Conversion". |
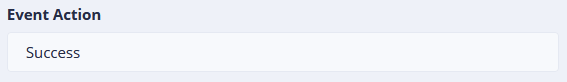 |  | The Event Action will display "Success". |
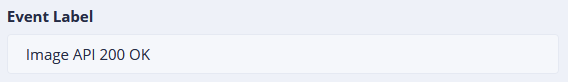 |  | The Event Label will display "Image API 200 OK". |
The end result is as follows:
 |
| Notice in particular the breadcrumbs as you have been drilling down to each new level of the event reporting. They will correspond with each of the inputs you made when you setup your event using the "Event Tracking" block. |
Exported data will look like this:
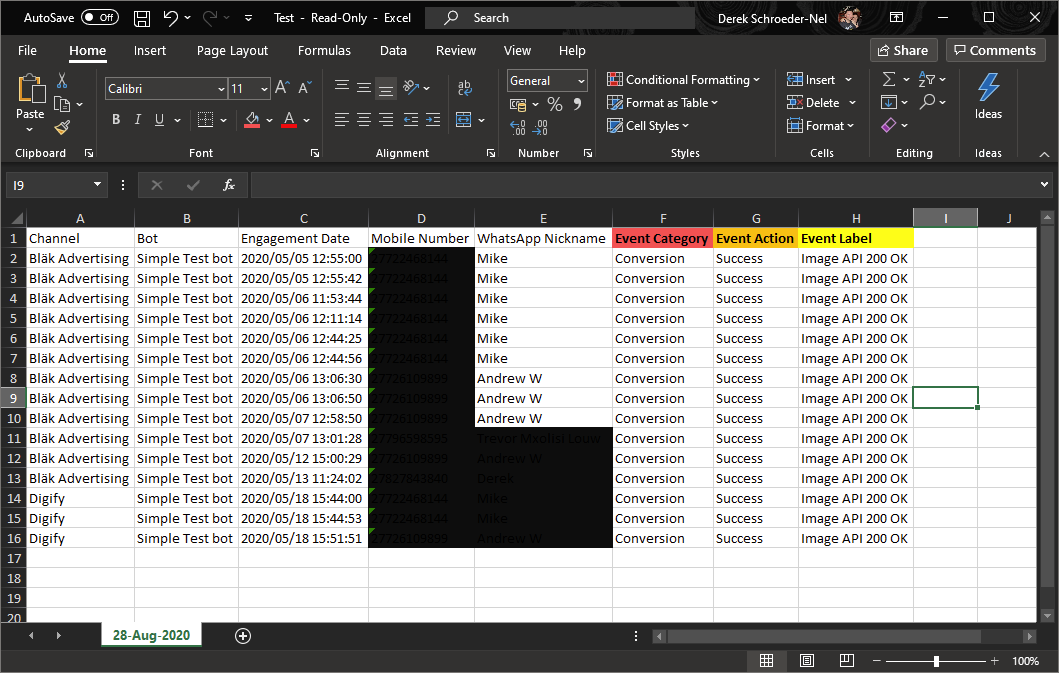
Note the highlighted column headings (red, orange and yellow) which will correspond with the reporting levels you drilled down to earlier as well as the corresponding event tracking values you input when creating the Event Tracking block in the bot builder itself.