
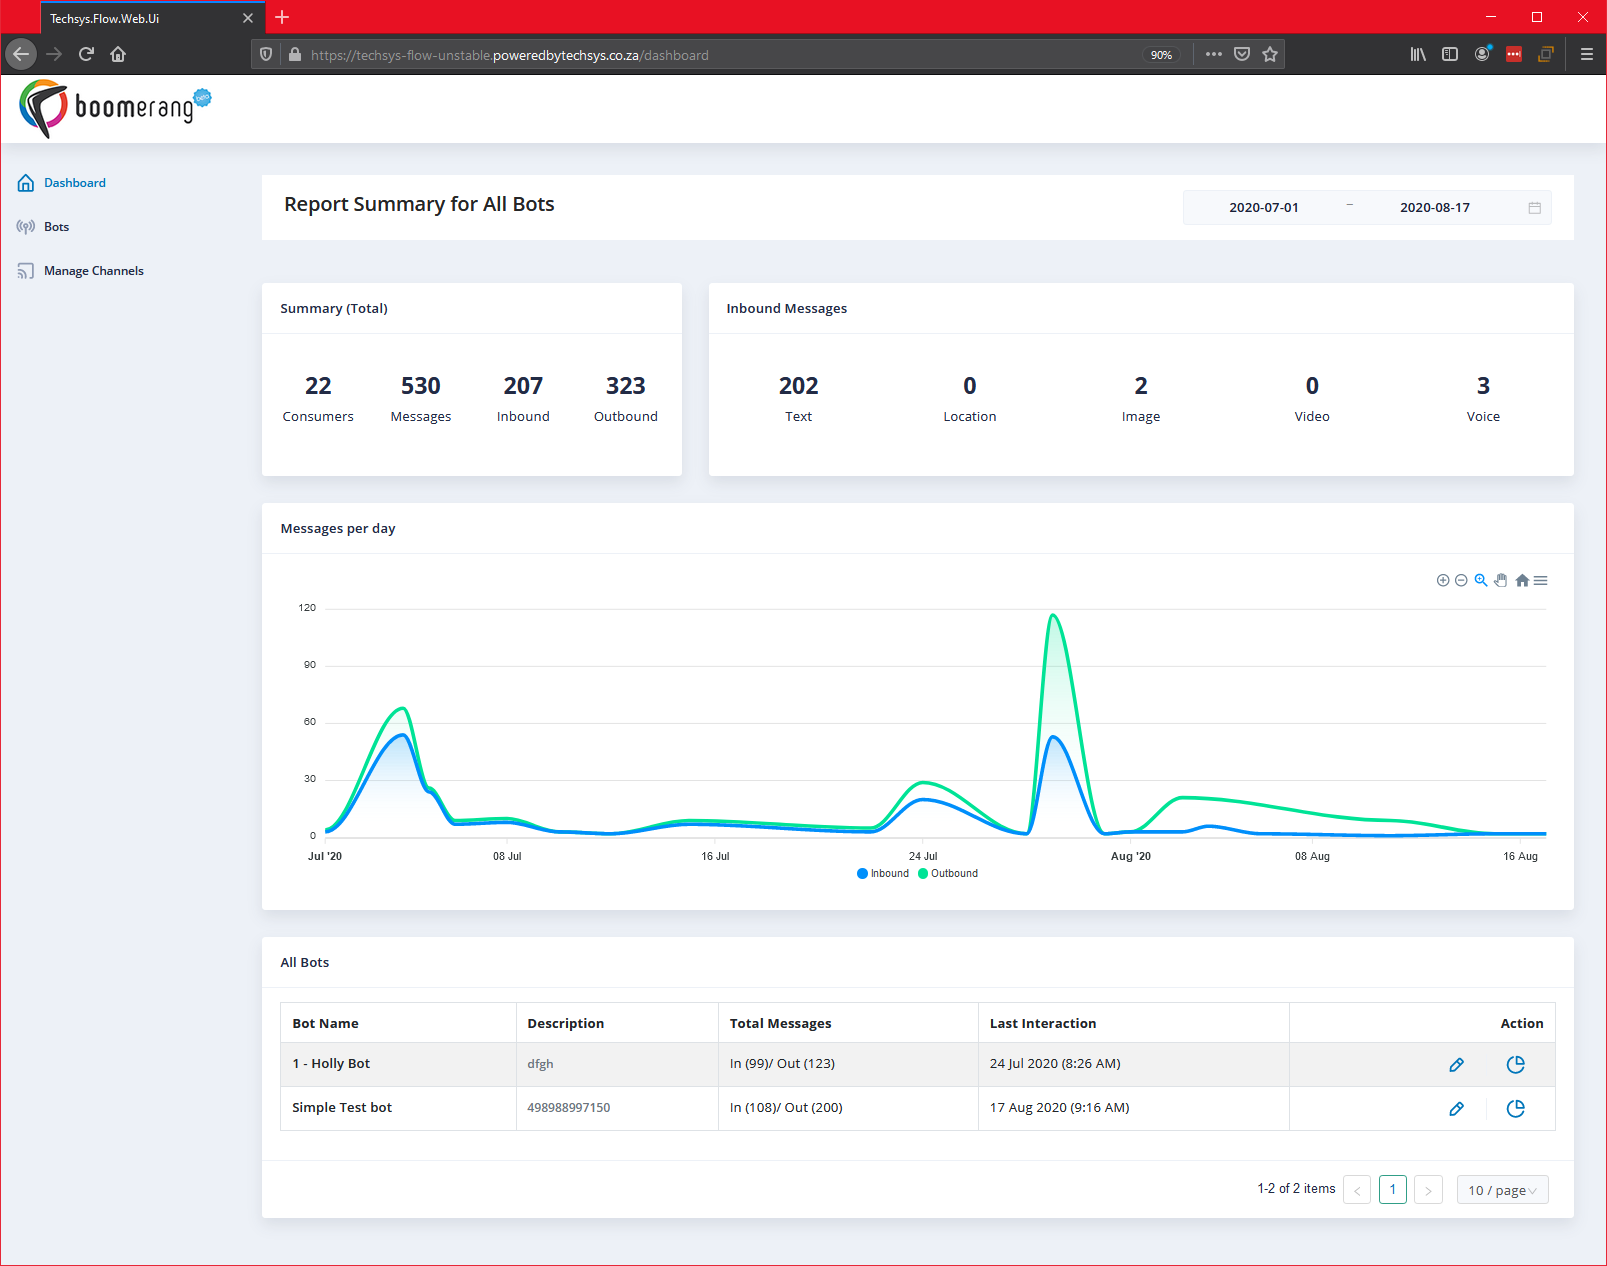
The Dashboard is the first page that will appear when you login to Buildabot.
There are a couple of sections from which a few activities can be performed here. They are:
- Navigation
- Date Picker
- Summary (Total)
- Inbound Messages
- Messages per day
- All bots
The window will look like this when you login:
Let's explore each of these elements in this article.
1. Navigation
Here is where you will be able to navigate to other parts of Buildabot. You can find your way back to the dashboard from here also. Other parts of Buildabot you can access from here are:
- Dashboard (default landing page on login and the scope of this article).
- Bots
- Manage Channels
Navigation looks like this:
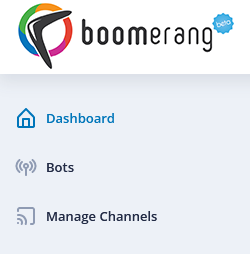
2. Date Picker
Use the date picker to select the date range over which you'd like to populate your dashboard with data.
Selecting your Start and End dates will result in all the data in the sections listed below to update with their respective metrics within the date range you have selected.
- Summary (Total)
- Inbound Messages
- Inbound Messages per day
- All Bots
The date picker.
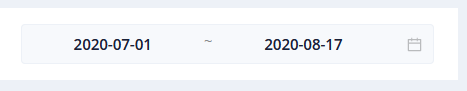
The date picker when opened up to select a Start and End date.
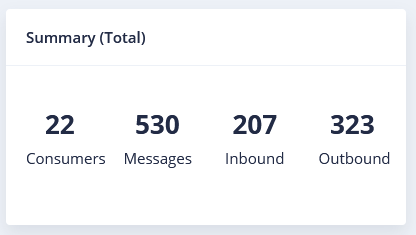
3. Summary (Total)
This block summarizes all of the metrics displayed over the selected date range.
It will show a totaled value for each metric over the selected date range.
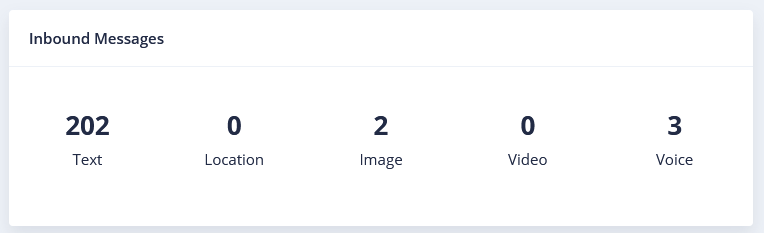
4. Inbound Messages
Inbound messages will show you a total breakdown of all messages received by type.
The sum of all of these messages will equal the total "Inbound" messages shown in the Summary (Total) in the previous section above.
5. Inbound Messages per day
This graph will show you the traffic in and out of your bot over the selected date range by "Inbound" and "Outbound" message traffic.
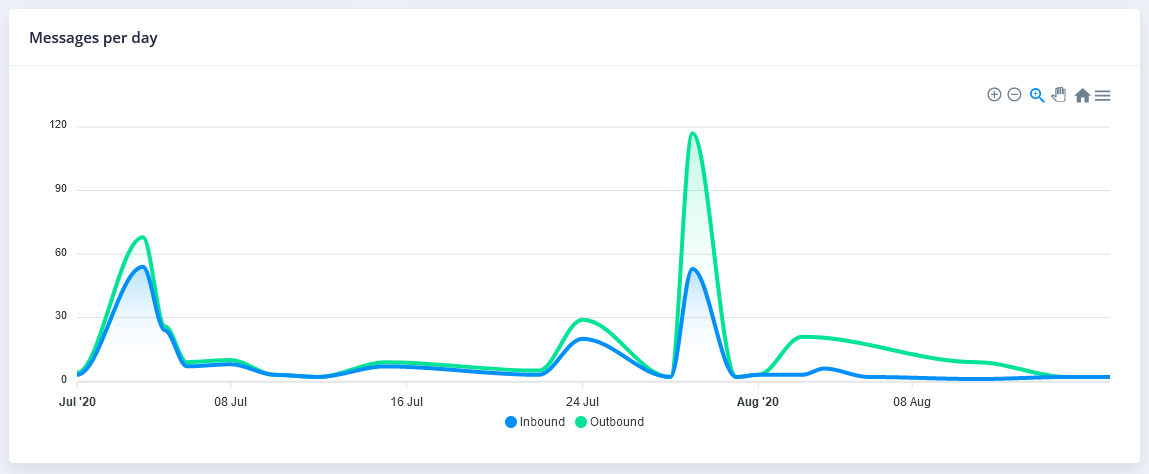
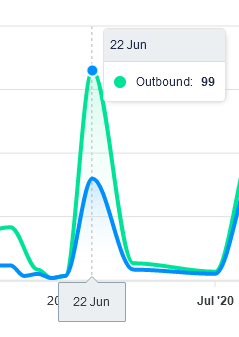
Mousing over the chart will produce a pop-up which will show you either the inbound or outbound messages for that day.
There is a small toolbar in the top right of the graph with which you can interact. It provides a few simple tools which we will unpack below. The toolbar looks like this:
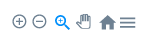
The available tools are:
 | Zoom in (Zooms in the chart). |
 | Zoom out (Zooms out the chart). |
 | Selection zoom (Drag on the chart (left to right) for the area you'd like to zoom in and focus in the graph. |
 | Pan tool (Drag the graph left or right to pan along the timeline). |
 | Reset the chart to it's default view. |
 | Download SVG, PNG or CSV files of the graph/data. |
6. All bots
All bots will indicate all of your bots that were active during the selected date range. They will show you the following information (as per the image below):
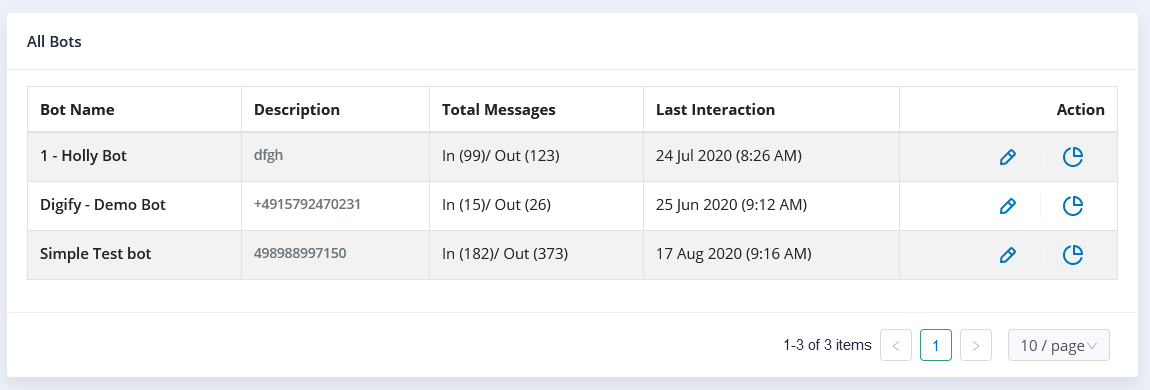
There are a few actions you can take in this section denoted by the "Action" column.
 | Click on the pencil icon to start editing this bot directly. This will jump you straight into the editor. |
 | Click here to see more detailed reporting for this specific bot. |